This is the sixth in our series of forestry related case studies to demonstrate the superior capabilities of the Routescene UAV LiDAR system for forestry management use. This LiDAR powerline vegetation management case study addresses the need to identify diseased or damaged trees or overgrown vegetation close to powerlines to prevent outages. Previous case studies have covered:
- Identifying and preserving ancient trees located on a construction development site
- Managing a forest under threat from an approaching plant pathogen
- Understanding the characteristics of forest fires to aid prevention and improve fire containment
- Understanding forest function to inform carbon reduction policies
- Using UAV LiDAR derived data to improve operational forestry management including timber harvesting and drainage patterns.
Powerline project aim
Electrical power has become an indispensable part of modern daily life and interruptions to supply cause economic and social consequences. Local outages are often due to trees and vegetation encroaching or falling onto powerlines and extreme weather events and natural disasters, affecting the stability of trees and vegetation, impact on a wider scale. We are witnessing an increasing number of extreme weather events due to climate change which confirms the need to implement rigorous powerline vegetation management practices.
The aim of this LiDAR powerline vegetation management project, a collaboration between Routescene, 2Excel Geo, Fera Science Ltd and Dielmo 3D, was to identify where vegetation was encroaching the powerline and to identify which trees may fall due to poor health and cause damage to the powerline.
The survey site
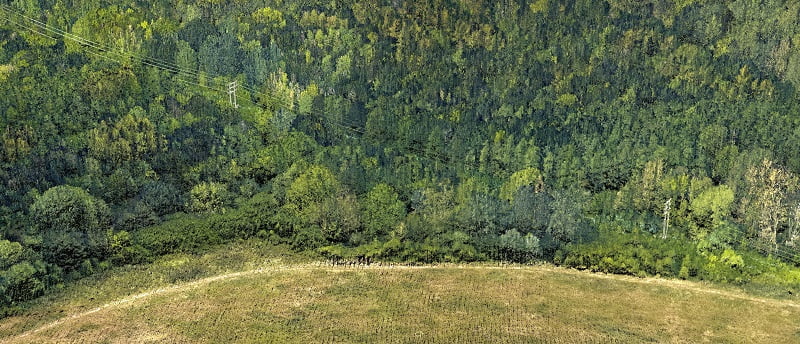
Pound Farm is a mixed deciduous woodland in Suffolk, UK. The area consists of ash, oak, maple and birch amongst other tree species. It is a mix of young and ancient woodland complete with wildflower meadows. The woodland is managed by the Woodland Trust, the UK’s largest woodland conservation charity, which manages over 1,000 sites covering over 26,000 hectares. The Pound Farm site is approximately 49 hectares (120 acres) and has 33kV powerlines cutting through the middle of the wood.
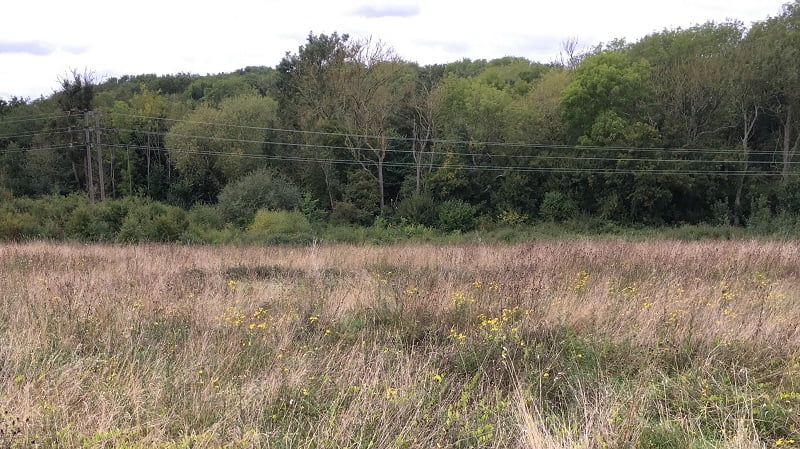
Pound Farm, a mixed woodland with wildflower meadows, transected by powerlines
In recent years the area has been badly affected by ash dieback, a highly destructive disease affecting ash trees prevalent in the UK. An objective of this project was to identify the different tree species in the woodland, in particular ash trees, to determine their health and potential risk to the powerlines.
Ash dieback is caused by a fungus, Hymenoscyphus fraxineus, which originated from SE Asia. It can kill young and coppiced trees quickly, however, older trees are able to resist it for some time. Symptoms include a blackening and wilting of leaves in mid to late summer.
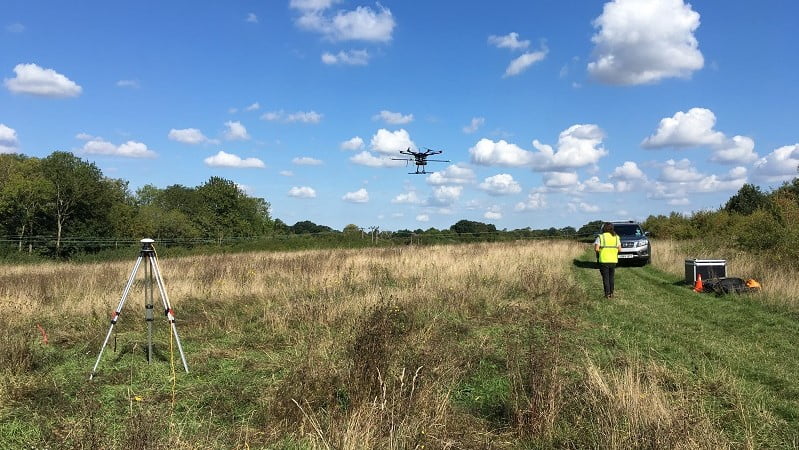
Survey team on-site capturing the LiDAR data from a drone
Survey techniques used to assess the woodland
The woodland and areas in close proximity to the powerlines were scanned using:
- Routescene’s UAV LiDAR system, flown on a DJI M600 drone at 40m (120ft) at a speed of 5m per second. A huge amount of LiDAR data was collected, more than 200GB and 150million points, over four flights, each flight duration around 15-20 minutes.
- True Colour (also known as Red, Green, Blue or RGB) and Hyperspectral imagery, flown at 3,000ft from a Piper PA31 Navajo light aircraft by 2ExcelAviation. Three cameras were operated: True-colour Phase One survey camera, a HySpex VNIR-1800 to capture visible, near-infrared imagery (VNIR) and a HySpex SWIR 384me to capture shortwave-infrared imagery (SWIR). The Hyperspectral data included reflectance at 186 bands spanning across the visible and near-infrared regions of the spectrum (410–1001 nm) with a spectral resolution of 3.26 nm and a spatial resolution of 0.32 m.
- Multispectral imagery, flown on a UAV at 100ft by Fera Science Ltd.
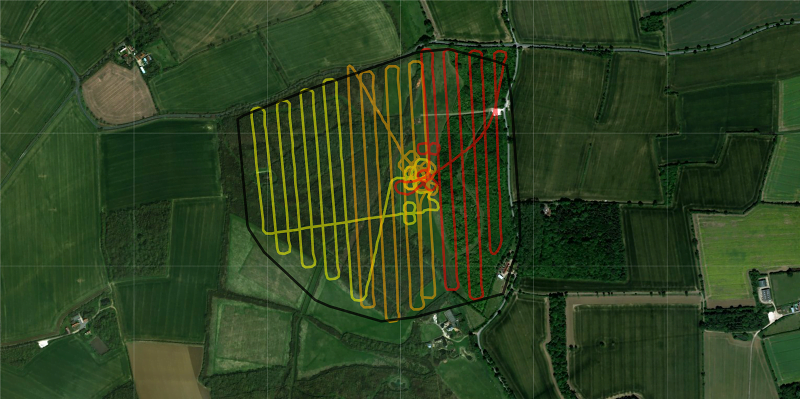
The flight lines undertaken by the UAV LiDAR system
Assessing different imaging techniques for powerline vegetation management
Four different imaging techniques, LiDAR, RGB, Multispectral and Hyperspectral, were used to appraise the ability of each to identify signs of Ash Dieback.
In summary, the excellent vegetation penetration capabilities of LiDAR enable a profile of an individual tree to be compiled from ground level to the canopy to examine tree health. Density analysis of the LiDAR data gathered from the crown of the trees can be used to identify disease. In addition, LiDAR can capture the thin powerlines easily to establish the proximity of vegetation surrounding it. LiDAR is not affected by shadows, which is a problem for RGB imagery and can be collected at any time of day.
Using RGB imagery it is very easy to visualize the trees, for example, to view the color of the leaves to determine tree health. RGB imagery can be merged with LiDAR data, giving each LiDAR point an RGB value, to colorize the point cloud. This provides true, life-like color to the LiDAR images, making them easier to interpret.
Hyperspectral and Multispectral imaging instruments enable data to be captured which are beyond the range of human vision. When statistically analyzed this data can help to identify the species, health and stress of the trees. In this project 18 vegetation indexes were used to check tree health. The best known is the Normalised Difference Vegetation Index (NDVI), which is a function of red and near-infrared energy that can indicate leaf area index, plant biomass and growth vigor.
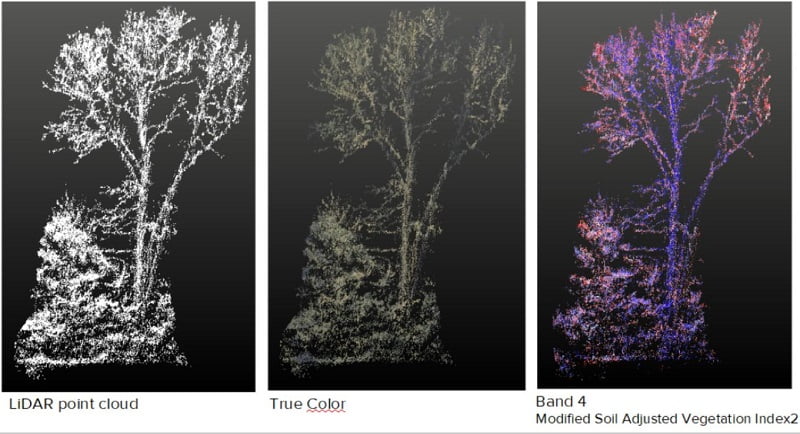
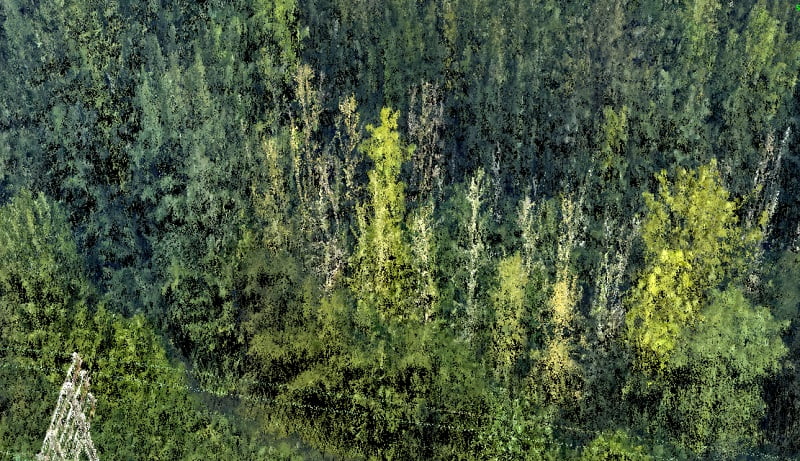
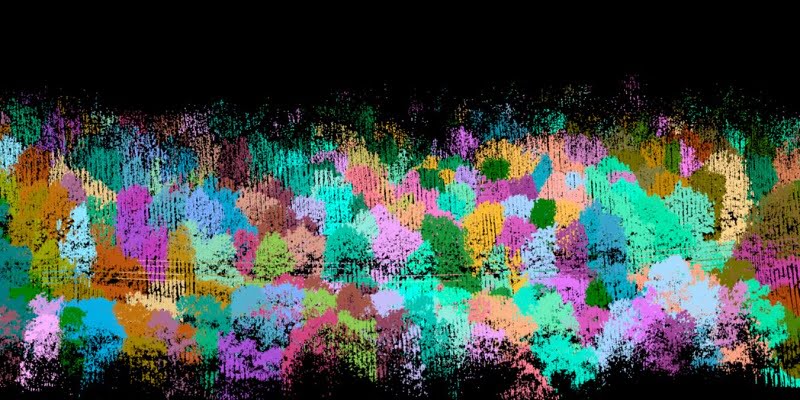
Outputs from the different imaging techniques used – LiDAR, True Color (RGB) and different bands of Multispectral
Quality Control and accuracy
The Multispectral, Hyperspectral and RGB data was collected early summer whilst the UAV LiDAR survey was performed in September. This caused some issues as the vegetation and tree foliage had grown during this period. Ideally, all of the data should have been collected at the same time.
To determine absolute accuracy ground control was established by accurately surveying in Ground Control Points (GCP) and placing Routescene LiDAR targets on those points. These 60cm highly reflective targets are easily identified in the resultant point cloud. See more about Routescene Ground Control Targets.
Data processing and analysis
In-depth processing of the LiDAR data was undertaken using Routescene’s LidarViewer Pro post-processing software. The analysis specifically focused on trees in close proximity to the powerline on the site to produce an ash dieback risk map. The team needed to provide outputs that could easily be interpreted by the Woodland Trust who are not geospatial specialists.
LiDAR point cloud of the woodland showing trees and powerlines cutting through
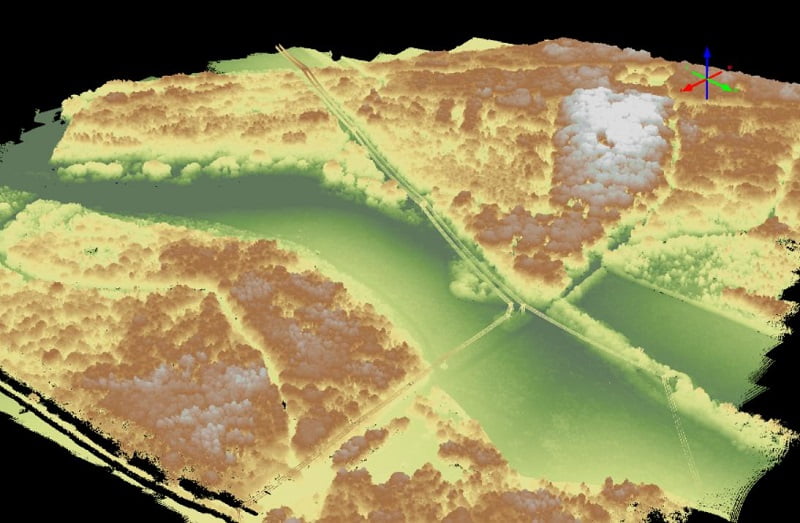
Step 1: Creating a Bare Earth Model
First, the team created a Digital Terrain Model (DTM) to precisely locate the powerlines and pylons. The DTM was used in conjunction with a Digital Surface Model (DSM) to ascertain the height of the trees (the Canopy Height being the difference between the DSM and DTM). This was used to calculate the normalized height and help identify individual trees.
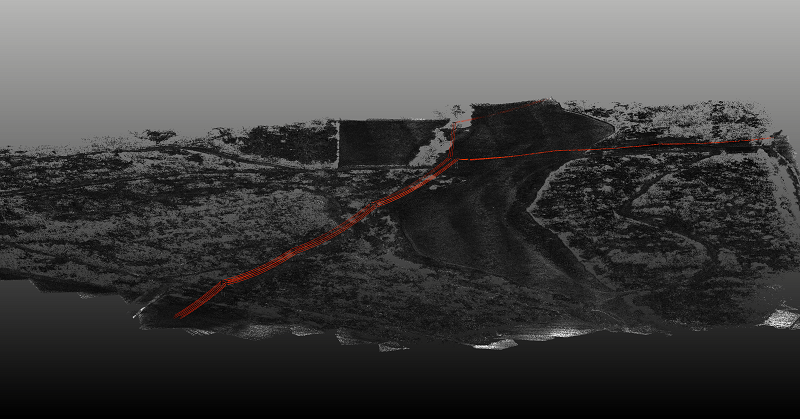
Ground points from the point cloud with the powerlines and pylons highlighted
This video shows the full point cloud and Digital Terrain Model with the position of powerlines, pylons and roads highlighted:
Step 2: Colorization of the LiDAR point cloud
The LiDAR data was then fused with the RGB imagery to produce a colorized point cloud. This colorization made it easier to view the different structures such as the powerlines and surrounding trees.
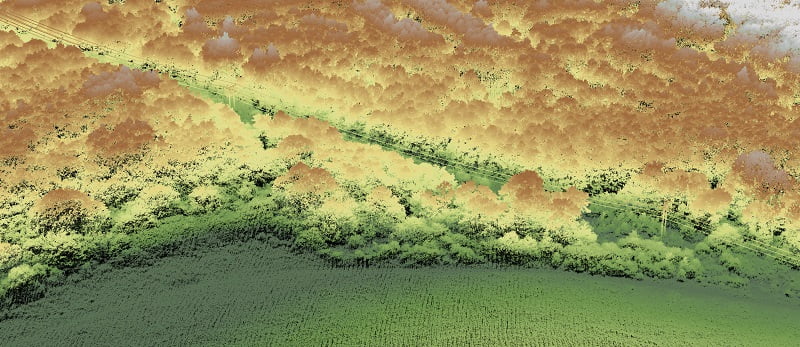
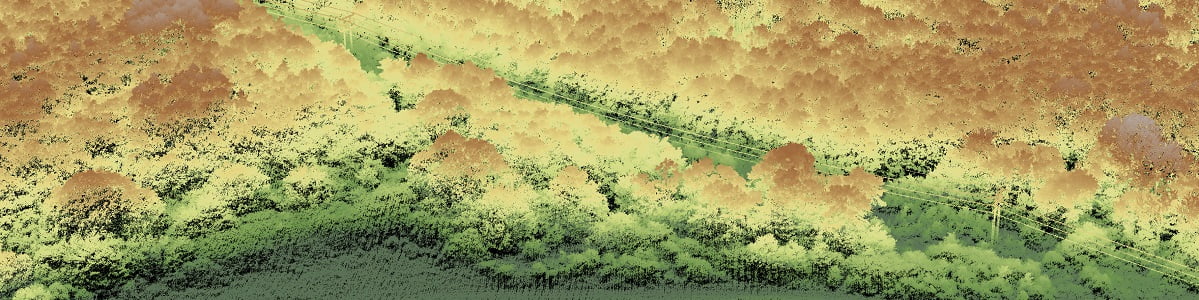
Before colorization: The LiDAR point cloud showing trees, vegetation and powerlines
After colorization: Features are easier to visualize using the merged LiDAR and RGB data
After colorization: The fused LiDAR and RGB data enables trees without leaves to be identified which indicates ash dieback
Step 3: Identifying individual trees
Individual trees were then identified using the R programming language.
Individual trees were classified along the powerlines
Step 4: Fusing Multispectral and Hyperspectral data with the LiDAR data
The LiDAR point cloud was combined with the Multispectral and Hyperspectral imagery using a series of machine learning approaches. The various vegetation indices, color and point cloud densities were analyzed to look for evidence of disease. For example, individual trees without leaves, with different colors of leaves, different vegetation index results or lower point cloud density values in the top layer of the tree canopy can all suggest disease.
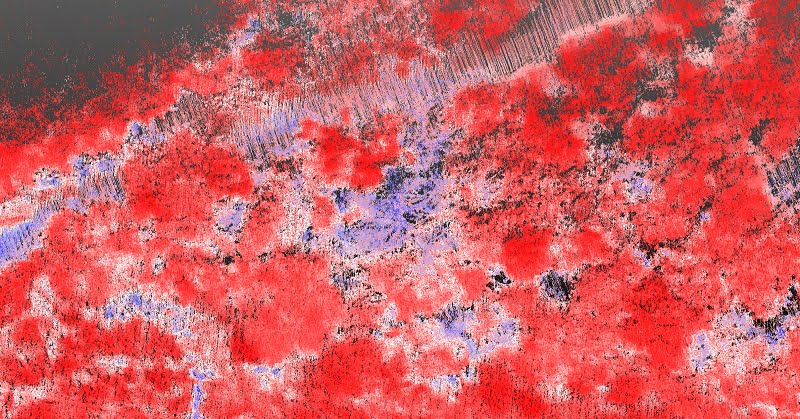
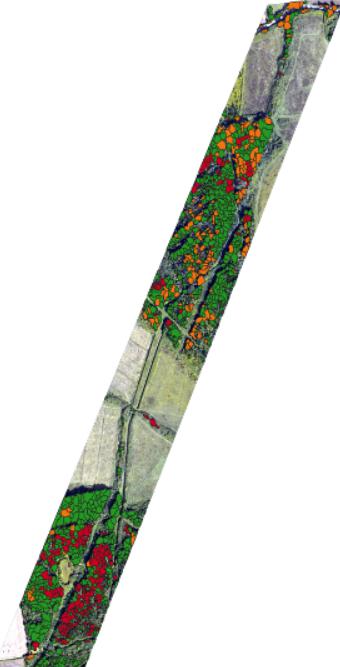
IR band 4 was used to identify diseased trees
Step 5: Density analysis of tree crowns
Density analysis of the LiDAR data and Hyperspectral data was then carried out, using data from the top 2 meters of the tree crown, to identify disease.
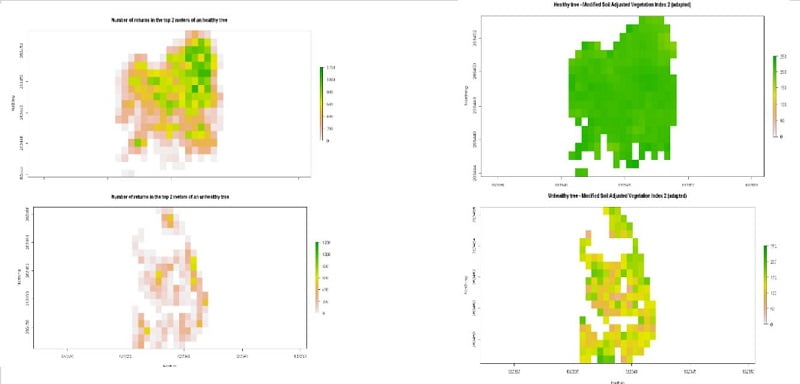
Analysis of LiDAR data (left-hand side) and Hyperspectral data (right-hand side) to detect disease. The number of returns from the top 2 meters of each tree were used; the top two images are from a healthy tree and the bottom two images from an unhealthy tree. Cell size 0.5m
Step 6: Final reporting to establish the risk to powerlines
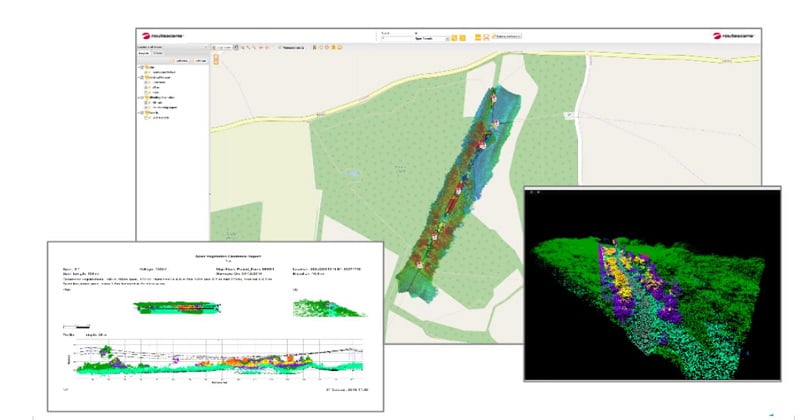
Finally, the LiDAR data was exported to Dielmo 3D’s web-based portal for visualization and reporting.
These results were used to identify areas along the powerline at risk from overgrown vegetation and diseased trees in danger of falling and striking the powerlines.
Final outputs to a web-based portal for visualization and reporting
Conclusion
This survey confirms the suitability of using UAV LiDAR data to assess tree health. The UAV LiDAR survey was proficient at capturing the thin powerlines easily within the woodland and the vegetation surrounding the powerlines. The results enabled the team to highlight areas of vegetation encroachment posing potential danger to the powerlines and “at-risk” trees suffering from Ash dieback which may cause damage to the powerlines. This information can be used to develop vegetation management plans to reduce the risk of power outages and forest fires caused by branches and vegetation hitting the powerlines.
Dr. Chloe Barnes, from 2Excel Geo, commented “The high density point cloud from the Routescene UAV LiDAR system facilitated the improved detection of individual trees within the woodland. The structural information provided by the LiDAR also provided complimentary datasets to the spectral information from the airborne imagery for tree health and species classification.”
Final outputs identifying vegetation and trees too close to the powerlines
Gert Riemersma, CTO and founder of Routescene, commented “This powerline vegetation management project showcased how useful and practical the outputs created from UAV LiDAR data can be to recognize areas of disease within a woodland. It also demonstrated perfectly how high resolution UAV LIDAR surveys can be used to identify individual powerlines and determine which trees and vegetation may cause damage either as a result of growth or disease.”
Contact us if you would like access to the dataset.
Additional information
- Ash Dieback – A threat to roadside hedgerows: An assessment from air and space
- Monitoring ash dieback (Hymenoscyphus fraxineus) in British forests using hyperspectral remote sensing
- Airborne laser scanning and tree crown fragmentation metrics for the assessment of Phytophthora ramorum infected larch forest stands